ParquetPlot
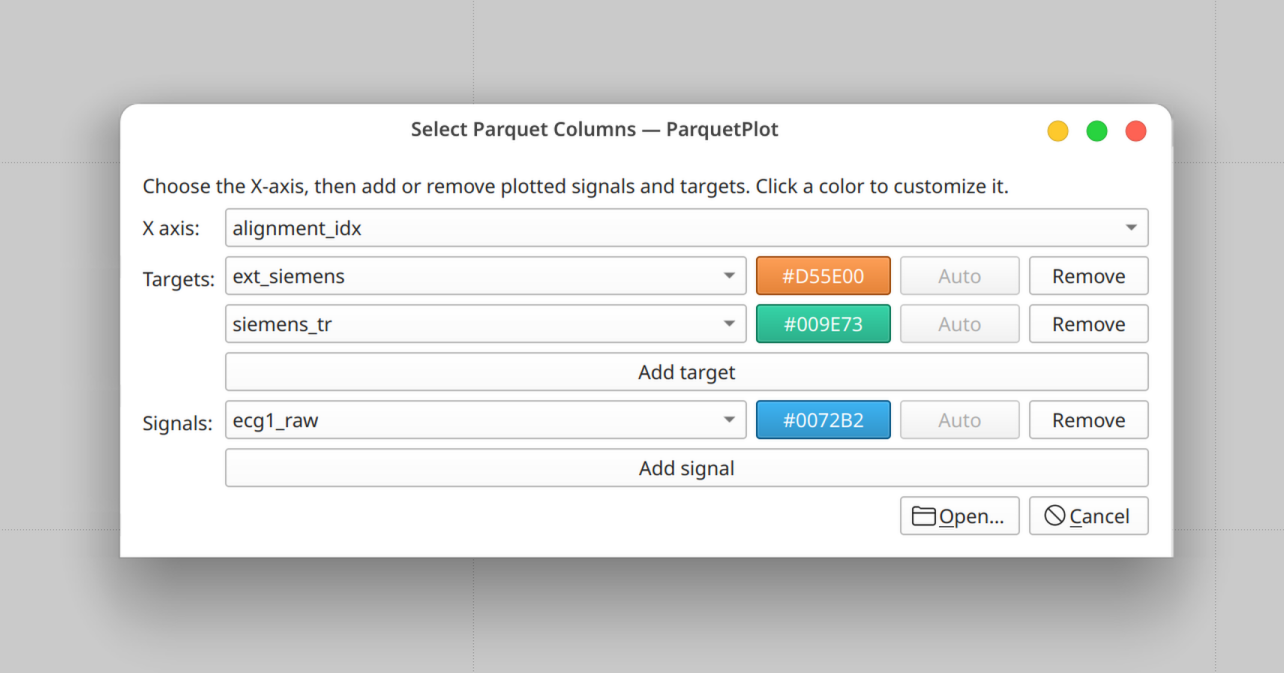
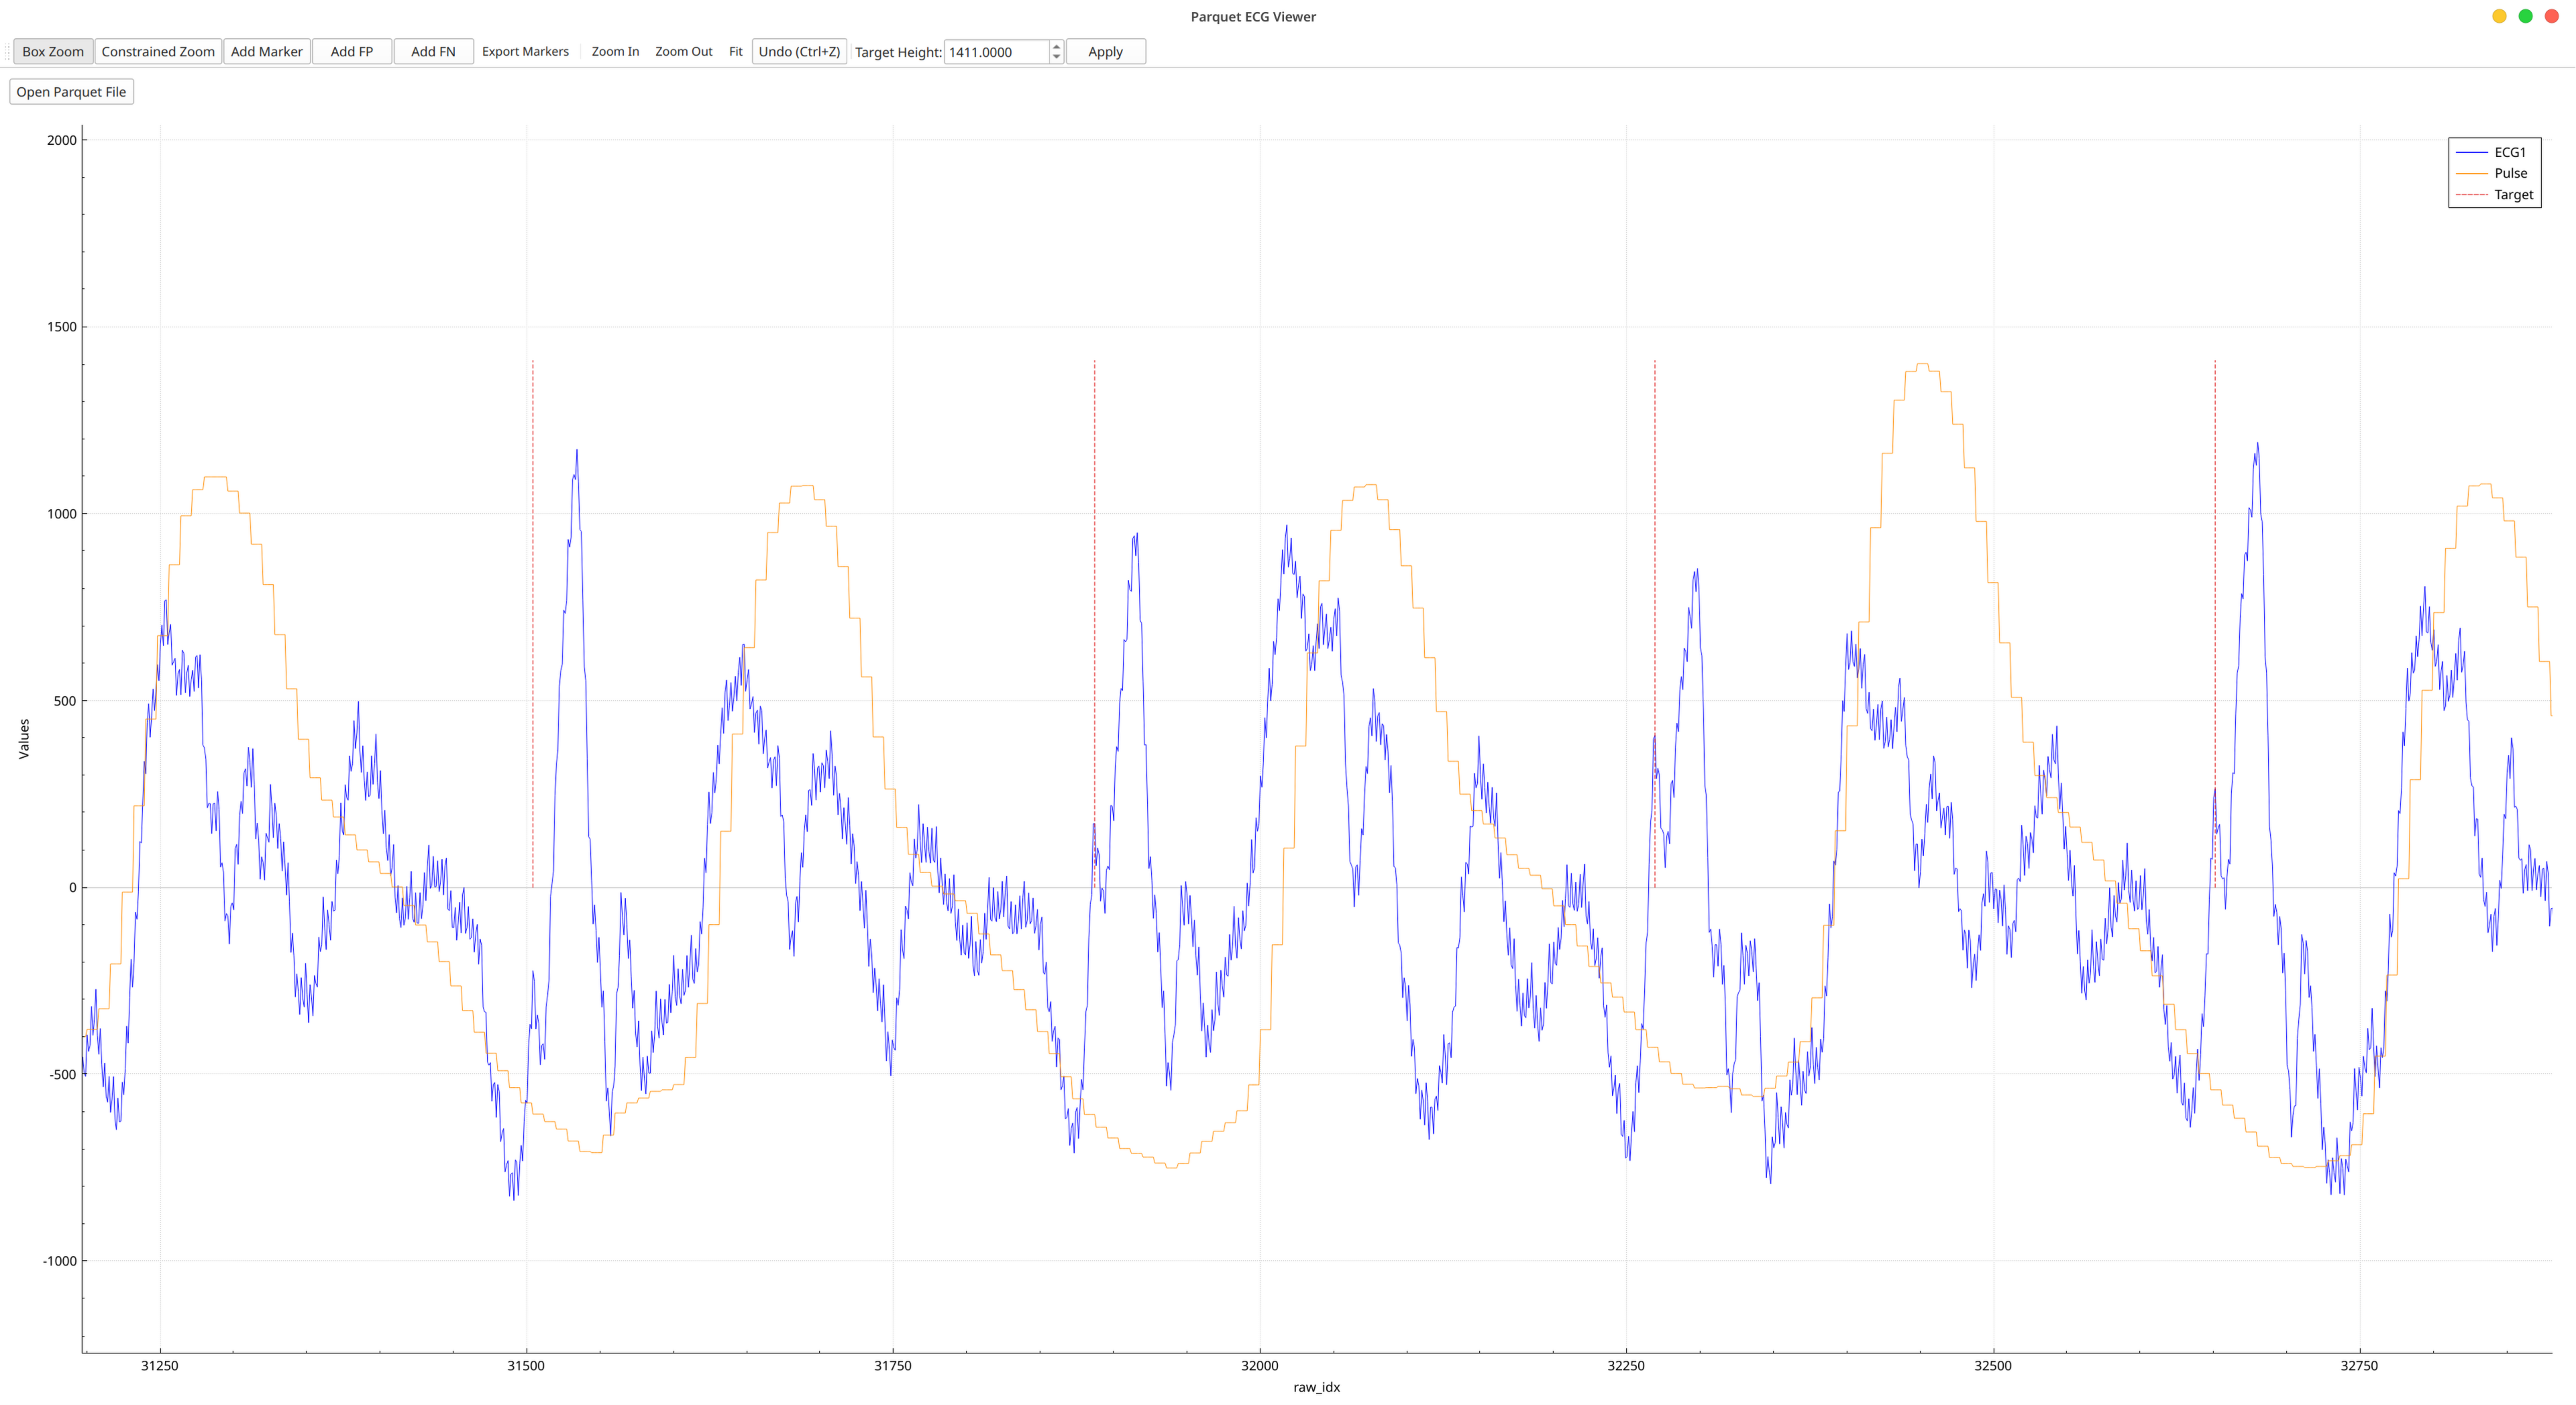
ParquetPlot is an interactive Linux/Windows desktop application for plotting data stored in Apache Parquet files. It overlays the data in a single responsive plot, or in stacked plots one over the other, sharing one x axis.
Screenshots
Features
Plot
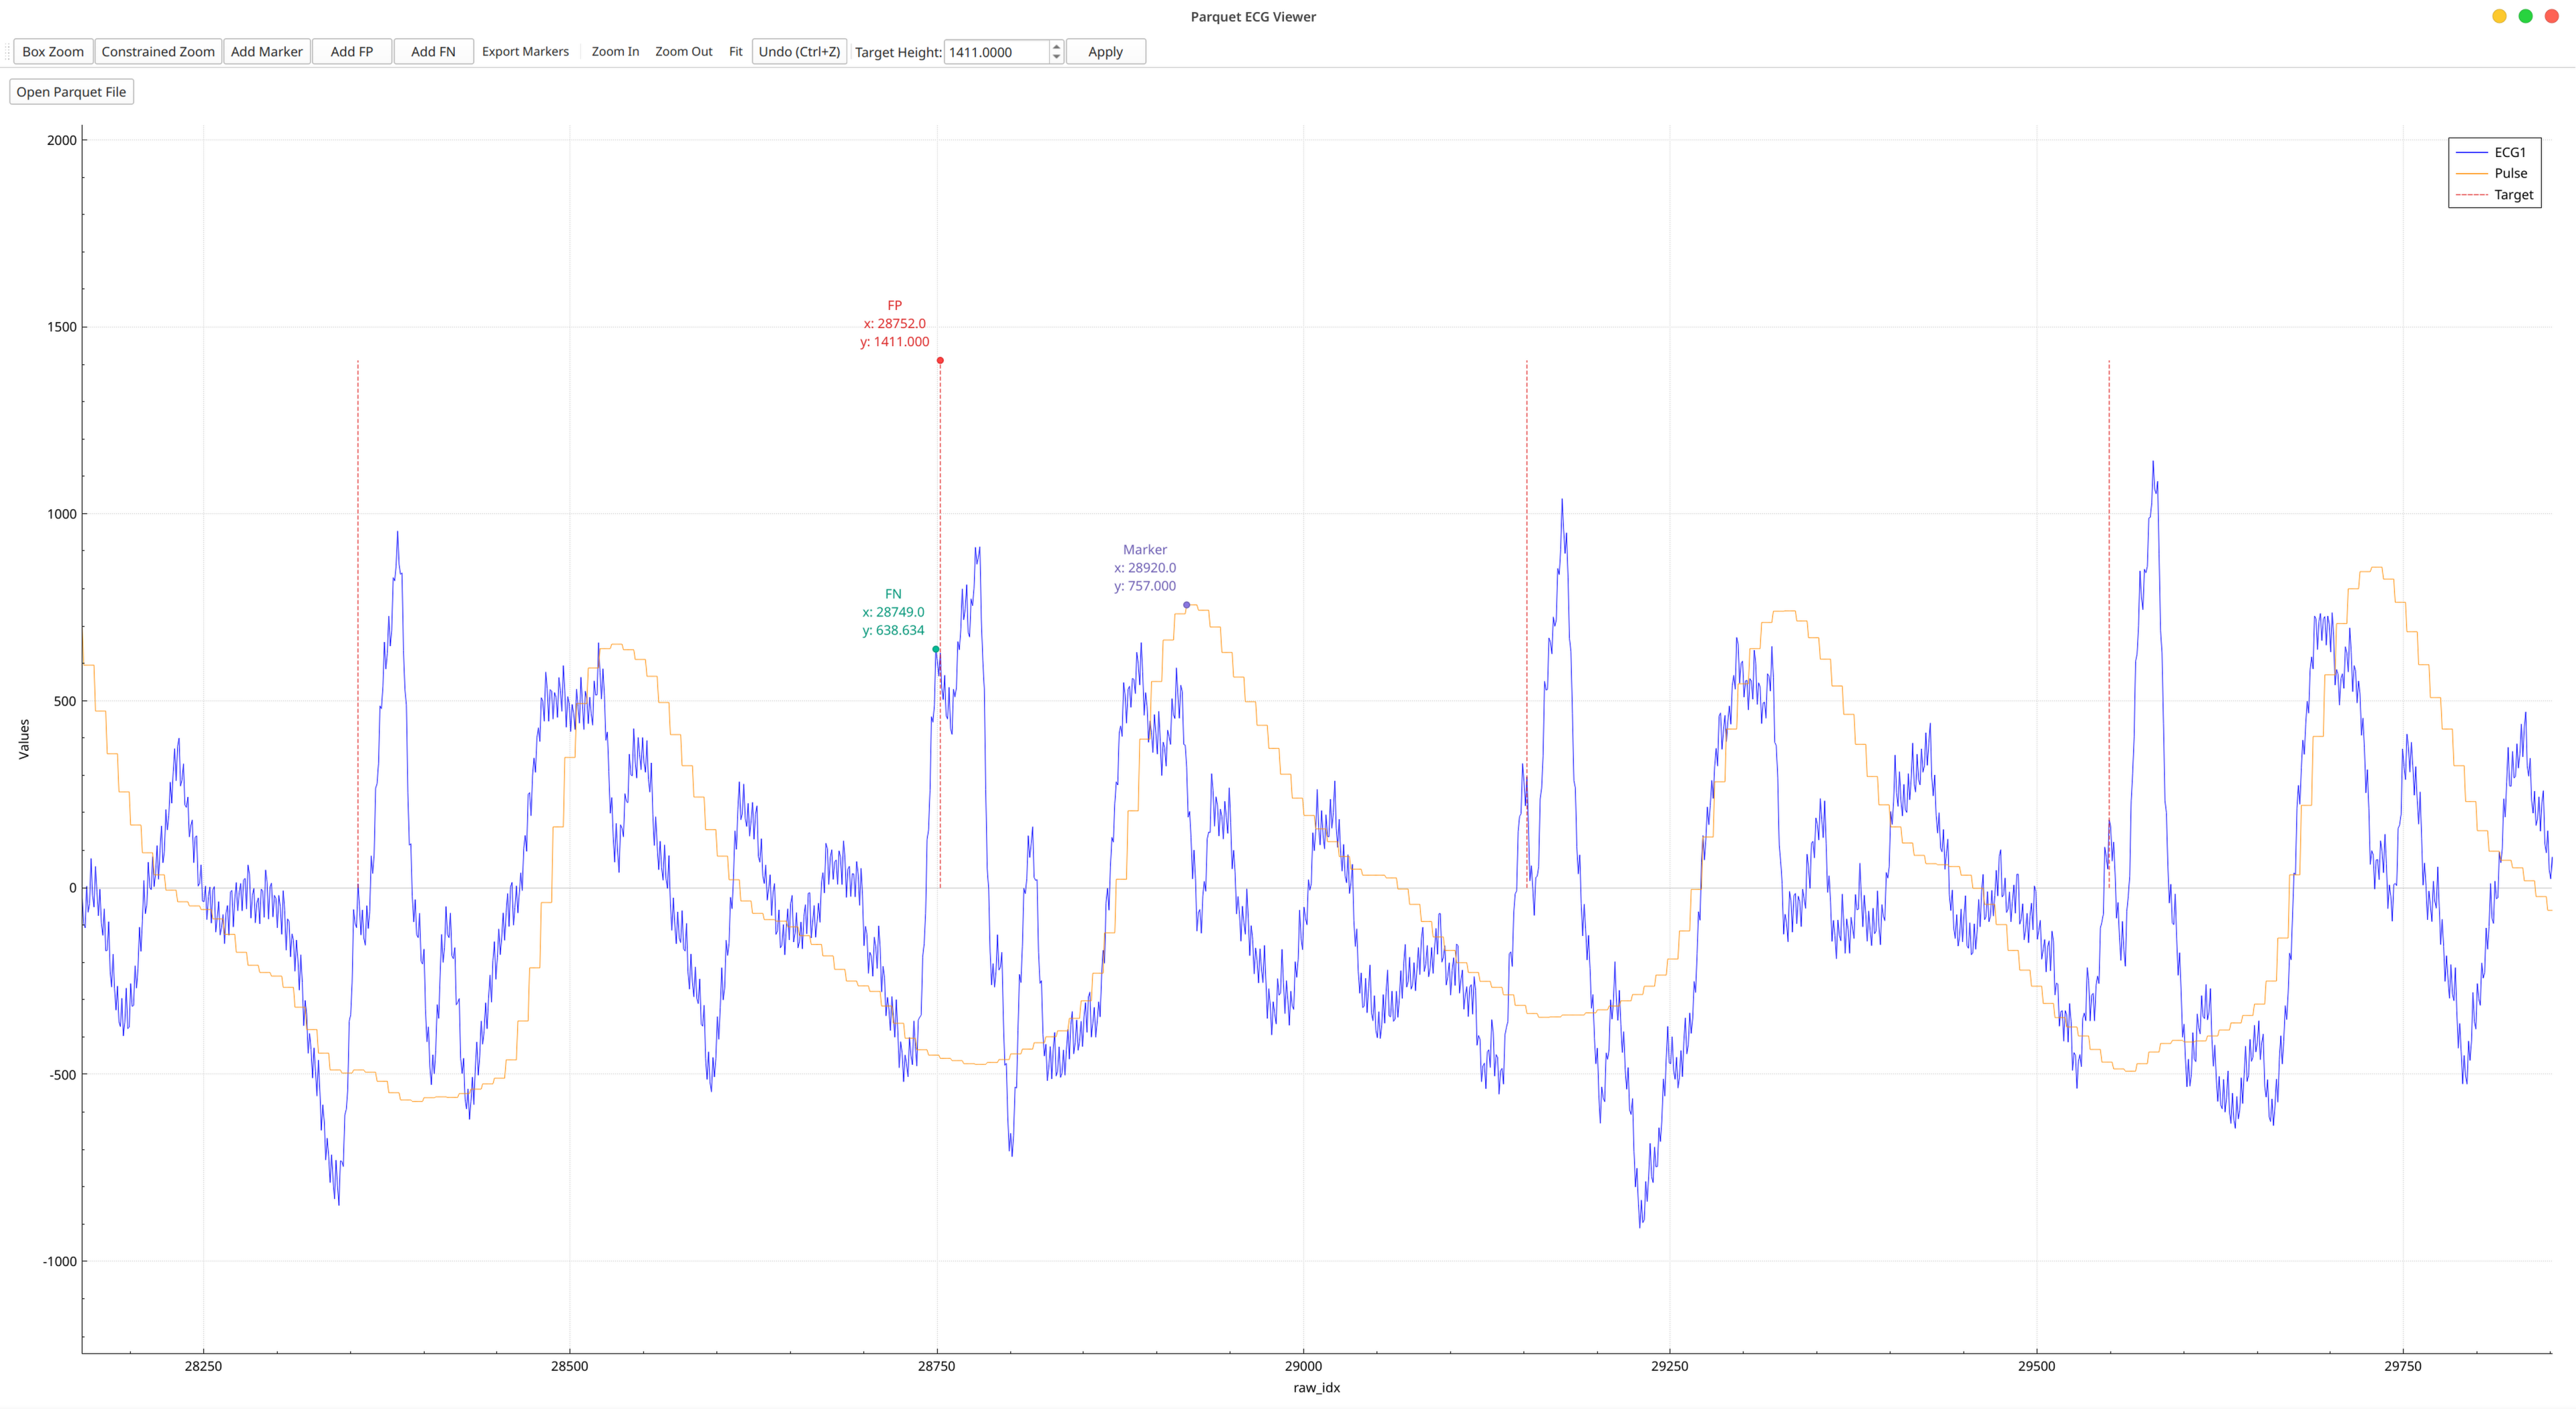
- Interactive zooming, panning, and coordinate inspection
- Clear overlays for ECG, pulse, and target annotation data
- Smooth handling of datasets with up to 350,000 entries
- Sequential loading and inspection of Parquet files
Table
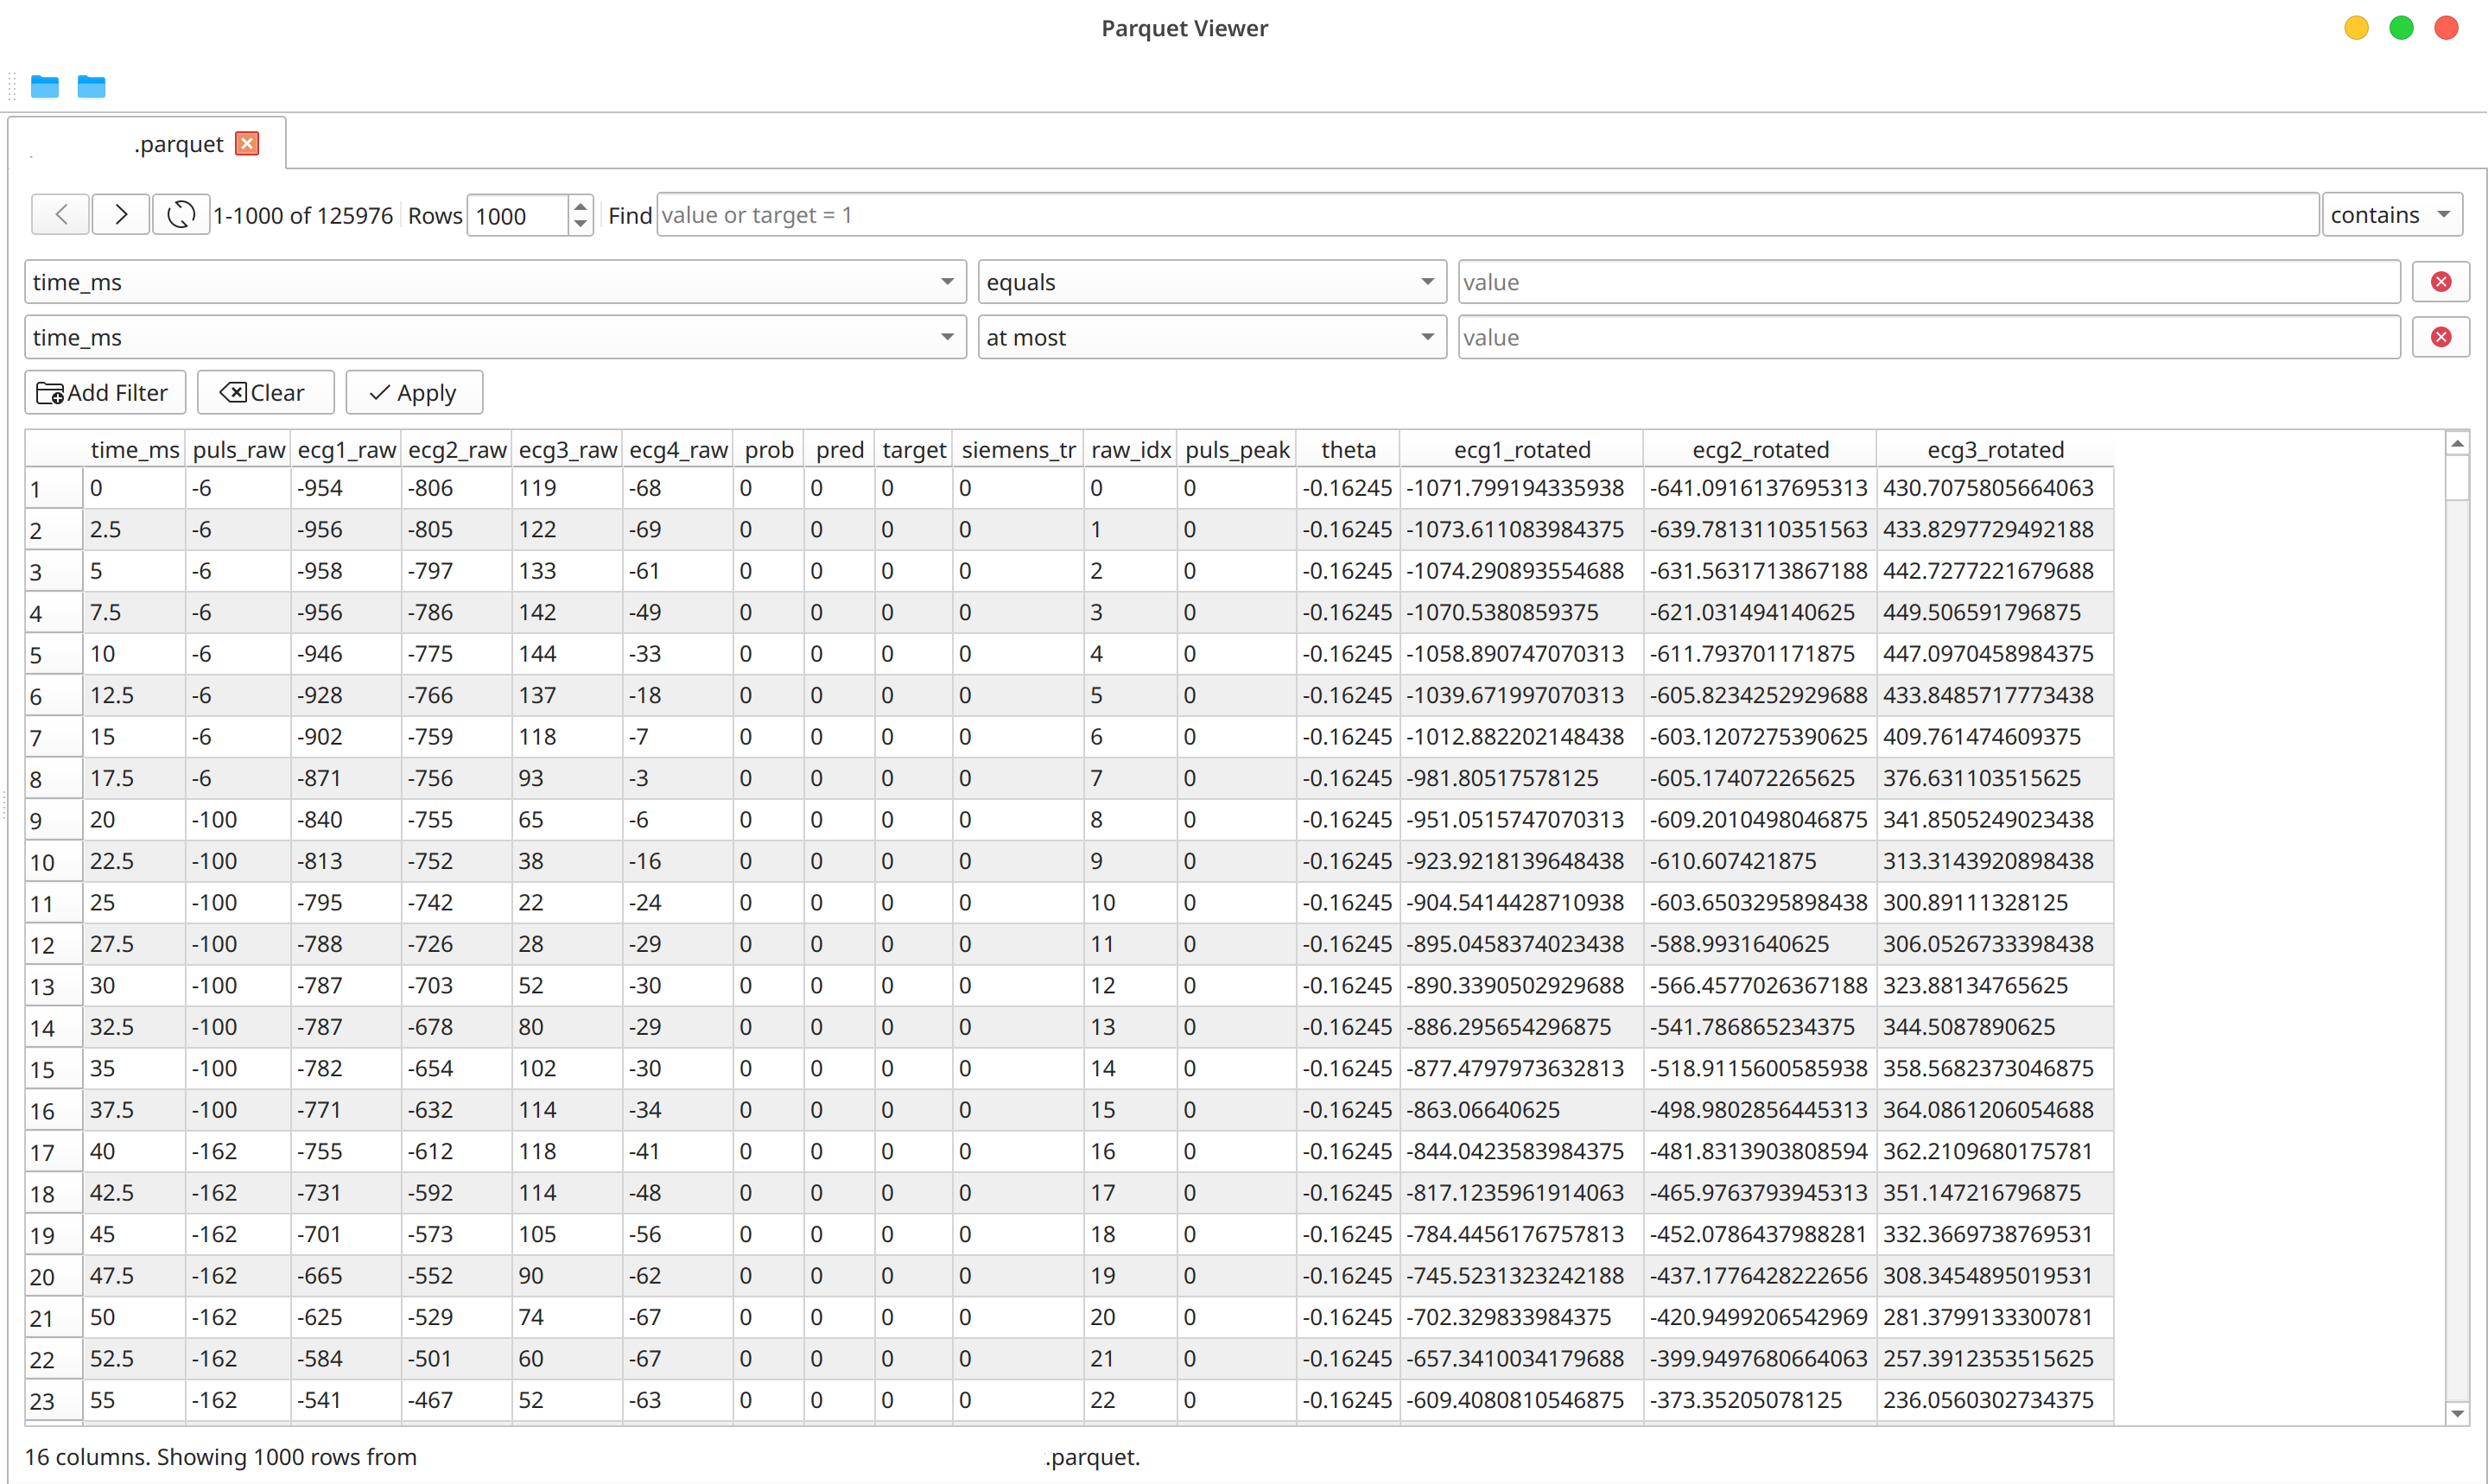
- VS Code-style file explorer and tabbed viewing of multiple files
- Paged table display for large datasets
- Global search across rows and columns
- Quick expressions such as
target = 1andscore > 10 - A visual filter builder for text, numeric, Boolean, and empty-value conditions
- DuckDB-backed scanning, filtering, and paging
Technology
The application is written in C++ and uses Qt 6, Apache Arrow, Parquet C++, and QCustomPlot. DuckDB performs the underlying Parquet queries in the tabular view, while the interface translates visual filters into safe query expressions. It is built with CMake and distributed under the GNU General Public License v3.0.
Disclaimer
This Software includes contributions by OpenAI’s Codex and AcademicCloud.
Copyright (c) 2026 Furkan Selim Cetin contact@furkancetin.dev
This software is provided “as is”, without any warranty or condition. To the extent permitted by law, the copyright holder will not be liable for damages arising from the software, its use, or its nature.